Unsupervised
The module of unsupervised contains methods that calculate and/or visualize evaluation performance of an unsupervised model.
Mostly inspired by the Interpet Results of Cluster in Google’s Machine Learning Crash Course. See more information here
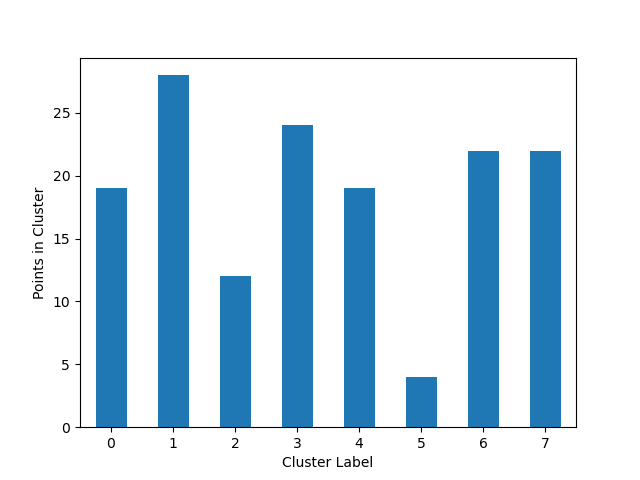
Plot Cluster Cardinality
In following examples we are going to use the iris dataset from scikit-learn. so firstly let’s import it:
from sklearn import datasets


iris = datasets.load_iris()
x = iris.data
We’ll create a simple K-Means algorithm with k=8 and plot how many point goes to each cluster:
from matplotlib import pyplot as plt
from sklearn.cluster import KMeans

from ds_utils.unsupervised import plot_cluster_cardinality


estimator = KMeans(n_clusters=8, random_state=42)
estimator.fit(x)

plot_cluster_cardinality(estimator.labels_)

plt.show()
And the following image will be shown:

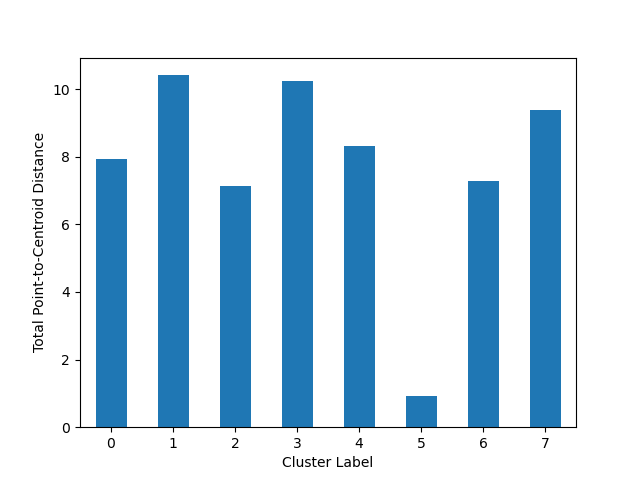
Plot Cluster Magnitude
Again we’ll create a simple K-Means algorithm with k=8. This time we’ll plot the sum of distances from points to their centroid:
from matplotlib import pyplot as plt
from sklearn.cluster import KMeans
from scipy.spatial.distance import euclidean

from ds_utils.unsupervised import plot_cluster_magnitude


estimator = KMeans(n_clusters=8, random_state=42)
estimator.fit(x)

plot_cluster_magnitude(x, estimator.labels_, estimator.cluster_centers_, euclidean)

plt.show()
And the following image will be shown:

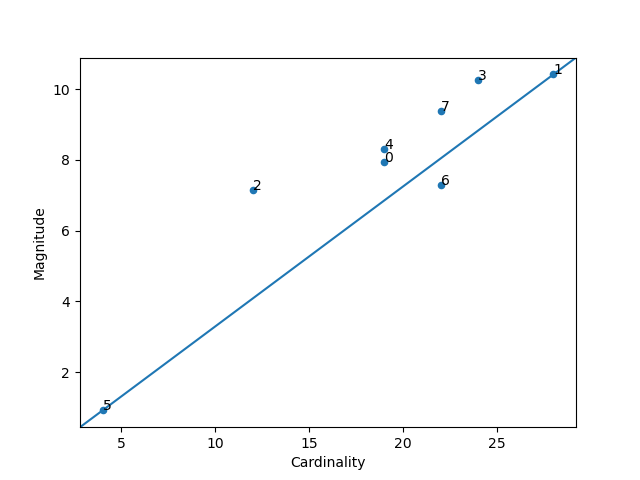
Magnitude vs. Cardinality
Now let’s plot the Cardinality vs. the Magnitude:
from matplotlib import pyplot as plt
from sklearn.cluster import KMeans
from scipy.spatial.distance import euclidean

from ds_utils.unsupervised import plot_magnitude_vs_cardinality


estimator = KMeans(n_clusters=8, random_state=42)
estimator.fit(x)

plot_magnitude_vs_cardinality(x, estimator.labels_, estimator.cluster_centers_, euclidean)

plt.show()
And the following image will be shown:

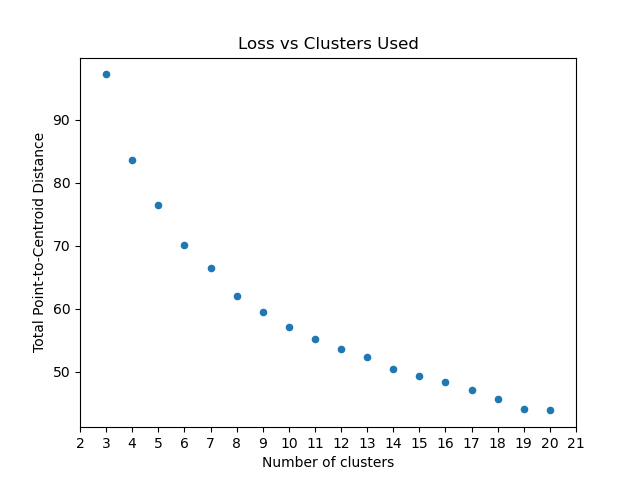
Optimum Number of Clusters
Final plot we ca use is Loss vs Cluster Number:
from matplotlib import pyplot as plt
from scipy.spatial.distance import euclidean

from ds_utils.unsupervised import plot_loss_vs_cluster_number


plot_loss_vs_cluster_number(x, 3, 20, euclidean)

plt.show()
And the following image will be shown:
